Innovation alphabet
GE-McKinsey Matrix
in a nutshell
The GE-McKinsey Matrix was born in the 1970s out of a collaboration between the consulting firm McKinsey and the General Electric company to develop a product portfolio management model. The result was a strategic analysis tool capable of providing guidance on which investments deserve higher priority to ensure growth at an optimal pace.

How to build the matrix
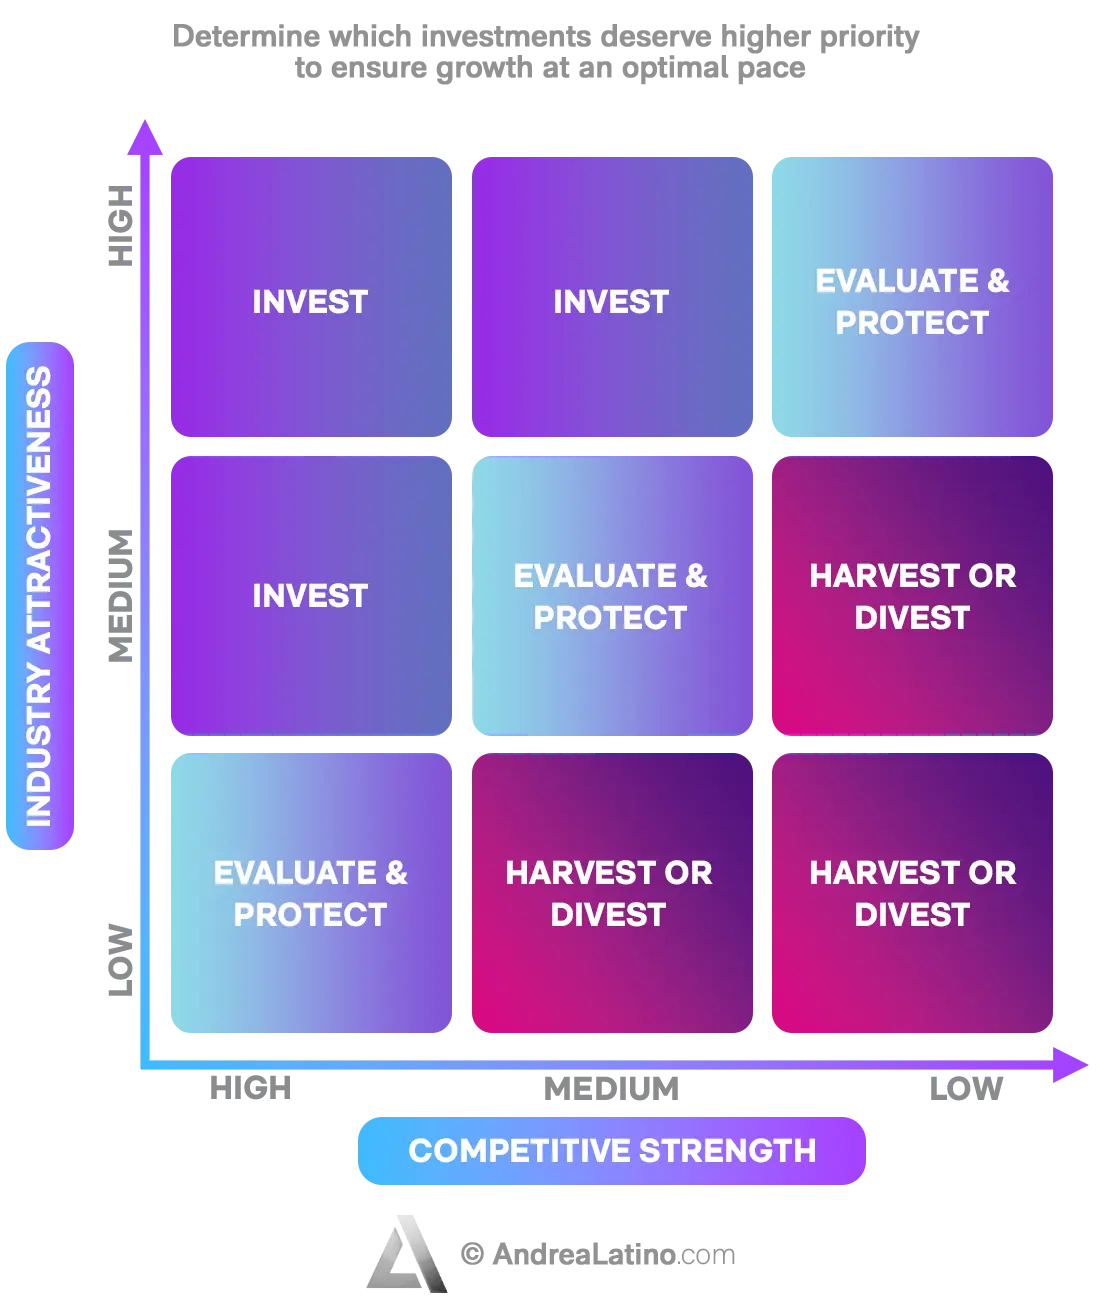
1) Determine the attractiveness of the industry for each product. “Attractiveness” refers to the degree of difficulty for a company to compete in a given market and earn profits. You can calculate it by considering parameters such as growth rate, share, market segmentation or the product itself. Determine weight, evaluation, and weighted score for each of the company’s products, as in the simplest IFE & EFE matrix. Each product or service will receive a score, placed on the y-axis of the GE-McKinsey Matrix in ascending order.
2) Determine the competitive strength for each product. The term “competitive strength”, on the other hand, indicates how strong a business or a product is compared to its competitors in the market in which they operate. You can figure it out by analyzing several factors, including brand awareness, company profit margins, or customer satisfaction. Just as in the previous step, attractiveness is calculated using the IFE & EFE matrix model. The score obtained for each individual product will relate to the x-axis of the GE-McKinsey Matrix in a decreasing sense.
3) Placement of products in the Matrix and reading the Matrix. If attractiveness is the ordinate and competitive strength is the abscissa, arranging the various points/products of the company we derive 9 quadrants: the three middle-high quadrants on the left will collect the growing investments, while the middle-low quadrants on the right will present the products on which it would be better to divest, as they have low competitive strength and low attractiveness. The remaining quadrants, which cross the graph diagonally, will contain products in an intermediate situation, which need to be evaluated: this could mean a low competitive position in an attractive sector or high competitiveness in a less attractive sector.


Do you have a Marketing & Sales challenge to tackle? Let’s face it. Together.
C-levels from these companies (AND MORE) relied on my expertise to overcome thEIR CHALLENGES IN THIS AREA. And You can, too.
Can I help you?

Industries
• GE-McKinsey Matrix in the IT industry
Even with a major brand such as Apple, it is possible to register several market trends: for example, iPhones, AirPods, and other services such as Apple TV and Apple Pay are steadily on the rise, while, on the contrary, some products are not even made anymore, including iPods, which were removed from stores in 2017.
• GE-McKinsey Matrix in the clothing industry
Starting with five-year data, a study in the International Journal of Business and Management presents several Italian fashion houses in the form of a GE-McKinsey Matrix. Among them, Benetton is part of those with medium attractiveness and good competitive strength. Moschino and Armani both have medium competitive strength but low attractiveness. Valentino, on the other hand, has high attractiveness but low competitiveness.
• GE-McKinsey Matrix in the video gaming industry
The video gaming industry is dominated by a multiplicity of companies, including Sony, EA, Activision, Microsoft, and Nintendo. It is a particularly profitable market. An analysis based on the GE-McKinsey Matrix looked at Sony and Nintendo: the results showed that video gaming devices made by Nintendo have a larger market share than those put out by Sony because they are simple and innovative, aimed at naturalizing the gaming experience. However, the devices made by Sony are far more sophisticated and use advanced technologies: as a result, they cost more. It follows that Sony should adopt a cost-cutting strategy that meets the needs of consumers.
Business Functions
• GE-McKinsey Matrix in support of R&D
Today we take electric cars for granted, but this has not always been the case: Ford decided to go electric only after noticing that it was still a niche market, bearing in mind that the design of electric vehicles is very different from the design of traditional cars. After choosing to expand its offerings, Ford now has found a greater attractiveness as a brand.
• GE-McKinsey Matrix in support of manufacturing
In 2006 Microsoft introduced the Zune mp3 player to the market. Don’t remember it? Of course not, because less than a year later, Apple introduced the world-famous iPod, wiping out the competition. From a market analysis, Microsoft decided to eliminate the Zune brand and its products after just two years. It was actually a good decision, because the media player did not have a strong presence or even market appeal, since most people had preferred to buy an iPod to listen to music.
• GE-McKinsey Matrix in support of strategy
Since Nestlé knew that it was going to compete in the FMCG market alongside other players such as Kraft Foods, ConAgra, Danone, and Mondelēz International, the company was able to understand and meet its customers’ needs following a careful analysis. In fact, the multinational corporation wanted to align its 7 cornerstones (strategy, structure, system, skills, staff, style, and shared values) in a mutually reinforcing way, succeeding in expanding its global market while maintaining a strategic organizational structure.
Stay in wonderland
Let me show you how deep the rabbit hole goes.
Check out more of the Innovation Alphabet:

3D Printing
3D Printing
“3D printing” is a process carried out by an electronic device which, instead of resorting to the canonical ink, it molds almost any kind of material: from concrete to living tissue, most usually plastic, but also metal. And the operating principle is similar to that of a traditional printer. The creation of three-dimensional models can lead to the redesign of a company’s production capabilities.
Dive In
5G
5G
5G is the new frontier of cellular telephony. It was designed to improve (or completely replace) previous generations of mobile networks. The 5th generation features lower latency, ensuring flawless performance of business applications and many other digital experiences – thus enabling the new cultural generations to furiously play Fortnite away from home.
Dive In
Advanced Analytics
Advanced Analytics
The term “Advanced Analytics” refers to the ability to autonomously or semi-autonomously analyze data and content to identify correlations, develop analyses, predictions, and recommendations. It is not just a matter of collecting information and then organizing it into watertight compartments: the ultimate goal is to identify a dialogue pattern from a data-driven perspective.
Dive In
Agile
Agile
Agile is an approach to software development designed to respond to change. Teams quickly analyze the context in which they operate, identify uncertainties faced, and figure out how to adapt to always move forward. Interaction between individuals comes before processes and tools; collaboration with the customer is more important than negotiating contracts.
Dive In
Ansoff Matrix
Ansoff Matrix
The Ansoff Matrix is a marketing planning model that arises from the intersection of new and existing products and markets. It derives four possible strategies for expanding the company’s market, which are built around four variables with a changeable factor of risks and possibilities: existing product, new product, existing market, new market.
Dive In
Artificial Intelligence
Artificial Intelligence
Artificial Intelligence is not strictly defined. Basically, it is a computer system able to make decisions in an independent and flexible way. A good AI application can perform everyday tasks better than an average person (e.g., identifying other people from their photos on social media or beating the best chess player). Nothing to fear, then. Unless you are a chess champion.
Dive In
Artificial Scarcity
Artificial Scarcity
We often tend to desire what we cannot have. Or what we are in danger of losing: Artificial Scarcity is a strategy that flaunts a limited number of items that do not correspond to actual availability. The goal is to stimulate the perception in consumers that the stock of items is about to run out and thus create a need based on the “fear of being cut off” or the intention to buy the item in order to resell it at a higher price.
Dive In
Attack Surface
Attack Surface
The term attack surface refers to the part of a system that may be subject to attack or breach by hackers. The smaller that surface is, the easier it will be to protect it. Indeed, the Internet is an ocean of deep, dark waters: those who navigate it must be aware that they are exposing themselves to a flood of digital risks. Yet, ironically, we do not need a big boat to shelter us.
Dive In
Augmented Reality
Augmented Reality
Augmented Reality is an ever-evolving technology that overlays multimedia information on top of our common sensory horizon to gain a deeper understanding of our surroundings. No, it doesn’t allow you to step out of the Matrix dream simulation, nor can it be accessed by swallowing a red pill. But neither is it the disturbing experience of the Playtest episode of Black Mirror.
Dive In
Balanced Scorecard
Balanced Scorecard
In business, as in life, you need balance. The Balanced Scorecard is a holistic tool for strategic management. It offers, in fact, the possibility of assessing corporate performance in its wholeness. An overview that embraces four perspectives: the business/financial side, customers and stakeholders, internal processes, and learning and growth.
Dive In